Thanks for the suggestion, Elliot.
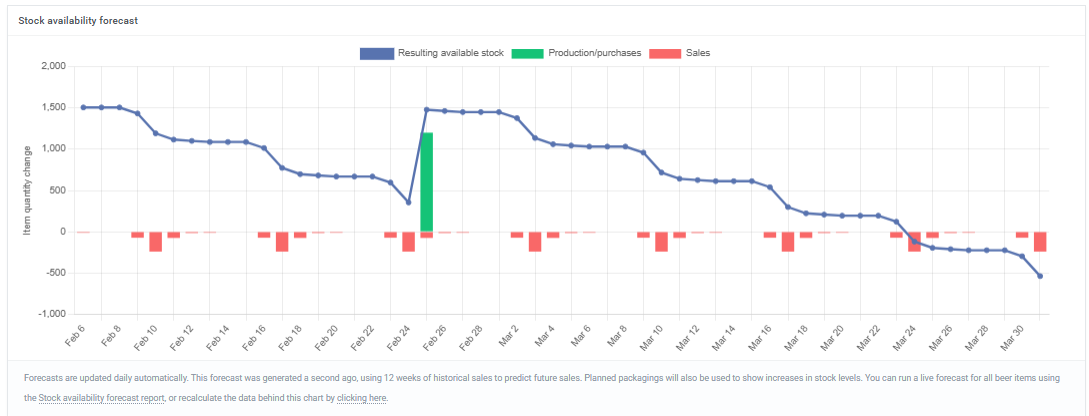
I can see where you’re coming from, but would it not be better to pick a saved sales forecast to use rather than the 12-week default? Or would you prefer to pick a time period, and if so, why?
To be honest, your suggestion has made me think it was an oversight by us not to have let you pick a sales forecast for this graph, when we first launched the new sales forecasting tools.
If you would still prefer to pick a sales period, as originally requested, do you mean to change the 12 weeks to another number of weeks (such as 6 or 24), or do you mean to choose fixed start and end dates? Thanks and sorry for all the questions!
Hi Luke, as much flexibility as possible would be great. For example it would be great to be able to forecast on February data from last year, rather than my current forecast being based on Nov/Dec which are non representative. I agree that using the saved sales forecast would be the ideal. But having this would also be very useful.
Quick question - how is this sales forecast caluculated for ‘one-off’ products? Is it based on sales of beers in that style?
Thanks Elliot, that makes sense.
Currently, Breww doesn’t know if a product is a one-off or not (there’s no field to specify this), so they are treated just like any other product. If an item hasn’t sold in the period that’s being used for forecasting, it will assume it won’t sell in the forecast either. With the new saved sales forecasts feature, you would be able to set a forecast yourself if the automatic one doesn’t realise that the product is likely to sell. I hope this makes sense.
You can now use a saved sales forecast on a product page! Head to Product settings to select your default sales forecast to show on product pages.
We hope this is useful.
This topic was automatically closed after 6 days. New replies are no longer allowed.